-
The
Clinical Services
of
Memory Care
of Arizona
Specialization
In Memory Care
Our clinics specialize in improving the memory of the elderly, and everyone who is suffering from memory loss.
Memory Loss
Common in Elderly
There are extensive medical conditions that will result in a loss of memory for everyone, and not just for the elderly. But as memory loss is more common in the elderly, most people think of them when thinking of memory problems.
Many Reasons
For Memory Loss
First, there are many reasons for a loss of memory to happen, and we list them and address them. This is important to know, because memory is a function of many areas of medical life.
Possible Reasons
for LOSS OF MEMORY
Mini-Strokes
Major Strokes
Chronic Stress
Loss of Sleep
Brain Injury
High Blood Pressure
Clogged Arteries
Dementia
Alzheimer’s
Many Ways
To Improve Memory
Second, because there are many reasons for a loss of memory, there are also many ways to improve the problems of memory loss. Memory Care of Arizona specializes in knowing the methods of improving memory.
A Complete Diagnosis
A full medical diagnosis of the problem in our clinics, with an EEG Brain Map, is the first step of determining what needs to be done. From this, Memory Care of Arizona proceeds to NeuroTherapy.
NeuroTherapy
NeuroTherapy is customized to fit the needs of each patient. Memory Care of Arizona’s therapy in our clinics is extensive, including Neurofeedback, Cognitive Rehabilitation, and Sensory Integration.
Memory Care of Arizona’s therapy is scientifically designed for memory improvement.


BRAIN POWER,
YOU CAN HAVE IT
-
INSURANCE
and
MEDICARE
The Question is:
“Will my insurance cover this?
The Answer is:
Medicare covers it.
and
Your insurance will most likely cover it also.
Give our office a call and talk with our insurance person. Ask her to check it out for you, and she will call your insurance company for you.
Let Us Do the Work For You by Calling Your Insurance Company For You


BRAIN POWER,
YOU CAN HAVE IT
-
Preventing
Alzheimer’s
The Disease Begins
Alzheimer’s actually begins over 30 years before the symptoms ever appear.
Good News
As a young to middle aged person, you may have the genetic risks, but can begin now to prevent the symptoms, and never have to experience the ravages of the disease.
The Brain Loses Cells
and
Acquires New Cells
Everyday, some cells are lost, and everyday new brain cells may be acquired.
The new cells will usually match the number of lost cells.
Problems happen when the number of lost cells exceeds the numbers of new cells.
Memory fails when the number of active working cells is reduced by one third.
Keeping the active working cells “alive” and doing well is important.
Replacing the dead cells with new ones, keeps the brain working as it should, and
Is the key to a healthy brain!
First
Use Early Detection
Neurological Screenings
of EEG Brain Mapping and
SPECT Scans
An EEG Brain Map
With an EEG Brain Map, you will discover how well your brain is working, or is not doing very well.
Find out where your brain waves are performing as they should, or where they are malfunctioning.
SPECT Scanning
See where your brain has enough brain blood flow,
and is getting enough oxygen, glucose, and nutrients.
Also, find out where your brain is not getting enough of what it needs to survive, as it should for good working memory.
Success Comes By
Therapy for the Brain
Use Brain Scans to Determine
The Current State of Your Brain
Then a Therapist can Tell You
How Your Brain May be Protected
And Improved
Some Medical Conditions
Mimic Symptoms of Alzheimer’s
Are there any Medical Conditions in Your Life that look like and act like Alzheimer’s?
But instead, they are just Medical Conditions that Cause a Loss of Memory to occur.
Such as:
Clogged Arteries
Thyroid Conditions
Sleep Deprivation
Vascular Dementia
Strokes
Mini – Strokes
Brain Injuries
Etc.
Learn how to overcome your medical conditions, to improve your memory.
After Doing an EEG Brain Map Evaluation, and SPECT Scan,
and, Should You find out that Your Brain Needs Some Repair and Conditioning,
DO EARLY INTERVENTION STRATEGIES
AS SUGGESTED BY YOUR MEMORY CARE THERAPIST
You will find detailed memory care strategies in the article:
“Preventing Alzheimer’s: The Power of Prevention through Delay”
And in
“Brain Tips: for Improving Your Memory”
This neurological process of protecting your brain becomes,
Prevention Through Delay
Remember,
Keep the GLOW
of
GOOD MENTAL HEALTH
In your life
-
Assessments
Of Memory
The primary evaluation is always the EEG Brain Map to determine where the brain is malfunctioning. The reason is that the memory problem must be identified and understood, in order to know what to do to correct the problem.
The Evaluation Steps
In Order
*******************
Medical Doctor Intake
Is First Evaluation
As a person comes into the Memory Care of Arizona clinic, the first step is to see the Medical Doctor for an evaluation. Based upon what the doctor sees, a number of assessments are ordered.
The First One the doctor orders is always the EEG Brain Map. Next, the doctor orders the neurological tests as in list below.
EEG Brain Map
Evaluations
The most important assessment is that of the EEG Brain Map, because it shows what is happening with the brain waves, of where they are FUNCTIONING, or NOT FUNCTIONING.
Blood Tests
And Evaluations
Blood tests are always a part of the initial assessments, to rule out any possible medical concerns relating to a physical nature, versus a neurological cause, for the loss of memory.
Cardiovascular
Analysis
This is to determine the nature of the cardiovascular system, as to whether or not the blood is properly reaching the brain.
Psychological
Assessments
A study of how well a person is able to emotionally cope with the problems of aging and their changing world.
Measurements
Of Memory
Cognitive measurements to determine the extent of the loss of cognitive skills and abilities.
Visual and Auditory
Evaluations
As visual and auditory functions may play a roll in loss of memory, these evaluations are a part of the initial assessments and also play a role in continuing evaluations.
Extensive Evaluations
Of Memory Conditions
The evaluations of memory are vital in the diagnosis of the problems relating to memory conditions. It is a most important step in the therapy of memory, for it is used to determine the type of treatment that will be best for achieving overall neurological improvement.


BRAIN POWER,
YOU CAN HAVE IT
-
REGISTERING
With
MEMORY CARE
Of ARIZONA
You May Register
For the Benefits
Of
Personal Knowledge
Talking with a Representative
Receiving Published Materials
Attending a Presentation
Visiting our Offices
Setting Appointments
QUESTIONS?
You might have questions. If so, call and ask our qualified counselors, and they will be most happy to work with you to your satisfaction in what ever you want to know. Just ask one of our Memory Care of Arizona Representatives.
BE OUR GUEST
AT A PRESENTATION
You might want to come in for a presentation as our guest. We will be happy to have you.
PRINTED MATERIALS
Perhaps you want to request published materials to read and study. Just fill out the on-line information, and we will be happy to send it out to you.
Memory Care of Arizona is Happy to Help You
-
Assisted Living
Locations
for
Seniors
The ability of many seniors as they go into Assisted Living Centers is greatly reduced from their normal abilities. This is due to many different conditions, many of which are reversible.
The important point to make is that, with the right information, life can become better.

Memory Care of Arizona has knowledge that enables the brain to do better.
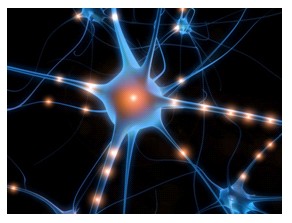
It is this valuable information that is used to create a program of improving the function of the brain, as is needed for seniors.
Whether it is in the medical offices of Memory Care of Arizona, or is within the facilities of Assisted Living Centers, Memory Care of Arizona uses the same incredible Memory Care Programs to achieve results.
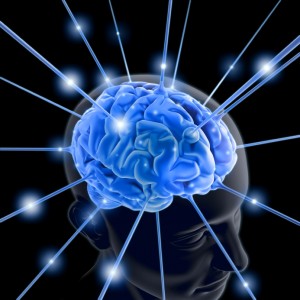
Memory Care Therapy
Improves
The Quality of Life
and
Adds
More Life to The Years


BRAIN POWER,
YOU CAN HAVE IT
-
BLOGGING:
ALL About the BRAIN
And Memory
Learn Something New
and
Make Your Life Happier !


-
NEUROLOGICAL
Improvement Of
MEMORY
Increasing
BRAIN POWER
To improve their memory, people have tried such things as learning cute little tricks to remember information, like people’s names and important dates that they always want to be able to remember.
But in reality, even remembering the “tricks” will be lost and gone when the brain physically starts to deteriorate and fall apart.
The solution for retaining memory is to prevent the brain from degeneration and from falling apart in the first place.
So, instead of letting the brain fall apart, take care of your brain and protect it. There are many ways to do this.
Learn ways NOW to take care of and IMPROVE your brain, and take action NOW to IMPROVE and PROTECT Your BRAIN.
Then you will actually INCREASE Your BRAIN POWER and MEMORY.
Neurological and Biological
Methods
To
Improve Memory
There are many reasons why a person starts to have memory problems, and most of them are because of medical conditions.
There are many different kinds of medical problems which cause the brain various problems with memory conditions and with cognitive processing.
Almost all of the brain’s memory problems are caused by a related medical condition.
When having a problem with memory, begin searching for a corresponding medical condition.
We list some of the medical problems here that will cause a memory loss, along with solutions for improvement.
Low Amounts of Brain Fuel
&
Brain Nutrients
The brain needs oxygen, glucose, and nutrients to survive, which it gets from the blood.
The brain must have what it needs from the blood, of the oxygen, glucose, and nutrients, or the brain will malfunction, causing multiple mental and neurological problems.
These will show up as memory problems and other related cognitive conditions.
Learn which foods are brain healthy and use them, and also use specific nutrients that will help improve the brain’s ability to learn and remember.
Avoid
The Terrible Triple 3s
Of
Cigarettes, Caffeine,
& Alcohol
These three are highly toxic to the brain, and they age the brain prematurely, away before its normal time. They increase the risk of having dementia and Alzheimer’s, and of course, cause severe memory loss.
Each of these toxic substances tightens the blood vessels, restricting the blood from where it is needed deep within the inner areas of the brain. This causes multiple neurological problems, including loss of memory.
Environmental Toxins
Are Bad!!!
Workers who have to constantly inhale environmental toxins, such as house painters with paint fumes, pesticides as sprayed within homes, and even hair dressers in beauty shops, have high risks for developing Alzheimer’s.
Insufficient
Brain Stimulation
When people do not have enough stimulation from their physical activities, or in mental situations, or in their social events, the brain will not make the necessary connections between its neurons as it should, with the result that the brain becomes slow and sluggish.
Without the needed stimulation to the brain, from physical, mental, or social events, the neurons stay small in size, reducing the speed between the brain cells. However, with increased stimulation, the neurons develop into “the improved version”.
Multiple Repetitions from physical, mental, and social activities will increase and improve the size of the neurons, causing them to be larger and stronger.
The importance of the Multiple Repetitions can be see by having larger and stronger neurons that will increase the speed between the neurons, and this increases the numbers of active communications between the brain’s billions of neurons, including those of memory.
A Lack of Mental
And
Neurological Activity
The phrase “Use It, or Lose It” is true here. Every day, from birth upward to our final years, the brain has neurons and cells that are being pruned, and these die away and are lost.
Without NEW mental activity, the brain does not make NEW brain cells. It needs NEW brain cells to keep the correct balance and ratio between of the active cells and the dead and dying cells.
By having the brain learn something NEW everyday, the brain accomplishes the state of neurogenesis, that it does in being able to rebuild itself.
Without NEW information coming in, the dead cells will outnumber the active live cells, and memory problems will happen.
With NEW information coming into the brain, the brain is in a wonderful state of neurogenesis, of the brain making NEW neurons and cells, and the brain continues to survive and thrive.
Chronic Stress
CAUSES Memory Problems
Under ongoing chronic stressful conditions, the body produces CORTISOL, a hormone that actually shrinks the hippocampus, which is a very important part of the brain. One of the jobs of the hippocampus is connected to storing memory, and as the hippocampus gets smaller from the CORTISOL from the stress,
the memory get smaller too.
Learn to relax, and as you do, the stress and the CORTISOL will reduce, enabling the memory to get better and improve.
A Loss of Sleep
Causes
A Loss of Memory
Waking up frequently during the night, without being able to have a solid night’s sleep, disturbs the sleep cycle causing slowness of the brain during the day.
The sleep disturbance may be from such things as sleep apnea, or even from multiple nighttime trips to the bathroom, and the problems of insomnia.
MELATONIN is a natural sleep aid that improves the quality of sleep, which overall is beneficial to the brain and body.
Research studies show that, Sleep Apnea is linked to Alzheimer’s conditions. Decrease Apnea and reduce the risk of having Alzheimer’s.
Overweight & Obesity
CAUSE
A Loss of Memory
Fat cells store toxins, and these toxins accumulate in the brain areas, restricting brain blood flow within the brain, causing many problems including a loss of memory.
As a person increases in weight, the brain decreases in size, and With Memory ……………….
Brain Size Matters.
High Blood Pressure
Increases Dementia
And the Risk of
Having Alzheimer’s
High Blood Pressure restricts the flow of brain blood flow, causing problems of memory and vascular dementia, as well as being a major factor for increased risk of having Alzheimer’s.
Reduce the Blood Pressure to within normal ranges, and this improves the overall mental and cognitive conditions of memory and related mental concerns.
Clogged Arteries
And Clogged Veins
One of the many problems of having clogged arteries with plaque buildup, is that the blood flow to the brain becomes restricted.
This restriction blocks the flow of blood with its oxygen, glucose, and nutrients from going into and reaching the brain where it is needed.This naturally causes a loss of memory.
The Nobel Prize in 1998 was won by Dr Lewis Ignarro for his work with nitric oxide. His research and discovery was that nitric oxide helps reduce the clogged arteries and veins.
There are new formulas that make the nitric oxide work 24 hours every day to clean out the plaque build up in the arteries and veins. Research confirms the success of this process in reducing the problems of arteries and veins.
Reducing the plaque allows the blood to go through better and increases the blood supply going to the brain, decreasing strokes and increasing brain function, including memory.
The information on Dr Ignarro, the Nobel Prize, and the newest formulas of nitric oxide can be found on the above menu bar under the title NutraCeuticals. Great Information!
Inadequate
Physical Exercise
The lack of regular physical exercise actually contributes to an overall loss of memory. Whereas having regular physical exercise improves the brain’s ability to provide a good memory.
When a person does not do enough physical exercise, the amount of blood flow going into the deep inner regions of brain is greatly reduced, and this causes memory problems.
However, when a person exercises, the pressure of the exercise forces the blood into the brain and down into the inner most parts of the brain, providing the much needed nourishment to this important brain area.
Research shows that exercise actually reduces the amount of Cortisol that stress causes. Lowering the Cortisol from stress, which reduces memory, actually allows the brain to increase the memory output.
Further research shows that physical exercise, by increasing the flow of blood to the brain, decreases the occurrence of dementia by 50 percent.
One of the best physical activities is that of dancing, which increases the cardiovascular abilities of the blood to reach the brain, and the coordination abilities to activate the cerebellum part of the brain, and increases memory due to both processes of the dancing.
Strokes
and
Mini-Strokes
Strokes are the result of clogged arteries and veins, and they are often the cause of Vascular Dementia. Strokes are easily recognized as they cause problems that are noticeable both to the body and the brain.
Whereas mini-strokes may go undiscovered for many years, they yield considerable damage to memory and other mental and cognitive processes.
A person may suffer from hundreds of mini-strokes without being properly diagnosed as having them, and yet the consequences of the mini-strokes are very noticeable when considering loss of memory and speech problems.
Decreasing the original conditions, of Clogged Arteries and High Blood Pressure that cause the strokes and mini-strokes, is a first step toward prevention and improvment. For this information, study the NutraCeuticals in the menu bar above to learn more about how to improve the body’s circulation and avoid strokes and min-strokes.
Brain Injuries
From falling off a bike as a child, to actively playing in sports such as soccer and football, or being in a car accident, large or small, brain injuries take their toll on the operations of the brain, including that of a loss of memory.
The problem is that most people do not usually recognize when they have received a brain injury. Again, the problem is that due to the injury itself, they do not recognize the symptoms they are experiencing of memory loss as relating to a brain injury.
Because people do not recognize or understand the problems they are having, the brain injury does not receive treatment, and the brain injury problems continue, with the person and family members around them wondering why they can not think or remember as well as they used to.
In this case, it is advisable to have an EEG Brain Map and a SPECT scan to determine the nature of the condition and the ways to overcome it with therapy.
Dementia
Dementia is a state of progressive impairments that interferes with a person’s normal ability to function naturally as they usually would do.
There are a large number of kinds of Dementia with varying causes and symptoms. The key to success in treating dementia is to recognize and treat it early on, in the beginning stages of the disease.
Frontal Lobe Dementia is one kind, originating in the frontal and temporal lobes of the brain. Success in treatment is rare.
Alcohol Related Dementia is another kind of dementia, and it is caused by alcohol. The problem is that alcohol negatively affects the brain in many ways, all of which are bad.
Unfortunately, the person does not recognize they are having problems and are in denial. This causes the drinking to continue, and the symptoms grow worse, losing memory and awareness of what is happening around them.
Vascular Dementia is caused by a number of diseases such as hypertension, diabetes, strokes, smoking, and alcohol, to name a few. The underlying cause is typically (1) clogged arteries that restrict the blood flow going to and from the brain, (2) the heart doesn’t pump strong enough, and (3) the blood is too thick and clots easily.
Take steps to reduce the clogged arteries, as in the NutraCeuticals above, as this dementia has the potential for vast improvement.
Alzheimer’s
This is a degenerative disease that begins over 30 years before symptoms ever begin to show. This means that prevention of Alzheimer’s may be available in the early stages if diagnosed early on, before the symptoms actually appear. With an EEG Brain Map and SPECT scan, the problems may be seen early on and are treatable.
The problems occur and start to show up when the dying brain cells exceed the numbers of new replacement incoming brain cells, and as this happens, memory loss occurs.
The disease at this stage may be contained or delayed, but never stopped.
Keep the GLOW
of
GOOD MENTAL HEALTH
In your life

-
The Nourishment
Of The Blood
To The Brain
The primary source of nourishment to the brain is from the blood.
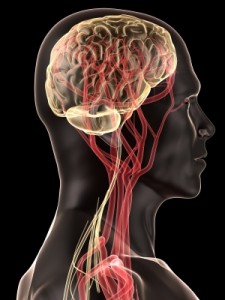
Oxygen, glucose, and nutrients are all from the blood going to the brain, and without a good, constant supply of these materials, the brain would falter and decrease in its ability to function as it should.
Therefore, the blood is of prime importance in taking care of the brain
to improve memory.
Should the arteries become clogged, as in atherosclerosis, and the carotid artery block the flow of blood from reaching the brain, the brain will malfunction, causing many problems.
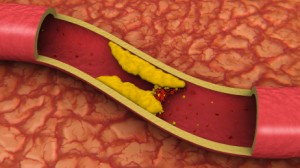
Hypertension,
as occurring
in clogged arteries and
arterial stiffness,
CAN BE A MAJOR CAUSE of Alzheimer’s, as the blood supply to the brain is greatly reduced, and this causes a loss of memory to occur.
Neurovascular Therapy should focus on improving the blood flow to the brain.
Therefore, we turn to the work of Dr Ignarro, for his contribution of increasing the blood supply to the brain by cleaning out the clogged, hardened arteries, with his Nobel Prize winning discovery of NITRIC OXIDE.

Dr Ignarro wrote the above book to be easily read and understood in order to promote the use of NITRIC OXIDE to benefit mankind.
This is the purpose of focusing on the very outstanding work of Dr Louis Ignarro, who won the Nobel Prize for his work in reducing blocked, clogged arteries with NITRIC OXIDE and improving blood flow.
NITRIC OXIDE is now in use as combined with L-Arginine to work 24 hours a day in cleaning out clogged arteries, and
IMPROVING BLOOD FLOW
TO THE BRAIN !!!


BRAIN POWER,
YOU CAN HAVE IT !

-
EEG Brain Mapping
Of all the brain imaging modalities, the most studied and replicated has been those with EEG and EEG Brain Mapping
Scientists can isolate, identify and pinpoint the location of those brain waves responsible for various behaviors.
EEG Brain Maps Measure
The Electrical Waves
In the Brain
A brain map shows
the condition of the brain
by the condition of
the brain waves.
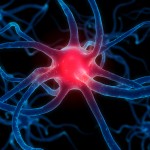
There are:
4 Kinds of Brain Waves
As Measured by Speed
Beta: – Small Fast Waves
Measured in 12 to 40 Hz
*****
Alpha: – Medium Waves
Measured in 8 to 12 Hz
*****
Theta: – Larger waves
Measured in 4 to 8 Hz
*****
Delta: – Largest &
Slowest Waves
Measured in 0 to 4 Hz
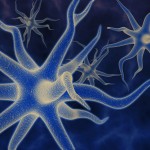
Brain Waves
As Measured by SIZE
Waves that are Too SMALL
The brain in UNDER ACTIVITY mode, as with depression.
*****
Waves that are NORMAL
With waves of NORMAL SIZE,
Life is Great !!!
*****
Waves that are Too LARGE
The brain in OVER ACTIVITY mode, as in anxiety.
*****
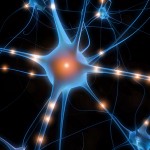
The EEG Brain Map shows the size of the waves, as in SMALL, NORMAL, & SLOW.
This tells us where the brain is malfunctioning, and what therapy needs to be done.
The object is to have the BRAIN FUNCTIONING at an OPTIMAL LEVEL at all times.

-
Neurofeedback
Is the Process of
Teaching Your Brain
About what
You Want It to Do

Tiny Electrodes record your brain signals, “live” from the computer carrying them directly to the screen, and as your brain “sees itself” of what it is doing right, and learns what it is doing wrong, it can self-adjust and self-correct immediately !!!
While watching your brain perform on a computer screen, you are able to see your brain in motion, as live on the screen.

As Your Brain “sees” Your Brain on the screen, You can instruct your brain to perform in “better” patterns of behavior.

Your brain is very smart, and as “it learns” better methods of behaving, it works to make the changes to a better way of operation.

It is THE BRAIN MONITORING ITSELF
As the brain learns, it self-corrects, and you can visually see the brain waves changing, appearing in their new changed improved forms, right on the screen.

This MAKES IT FUN !


BRAIN POWER,
YOU CAN HAVE IT
-
Improving
Brain Power
Everyone has a Brain,
And Everyone
Wants to Have
Their Own Brain Improved !!!
NOW It is POSSIBLE !!!
Neurofeedback
Is the Answer
Research from around the world has shown the beneficial affects that Neurofeedback provides, and this goes from those who are very young, to those who are very old.
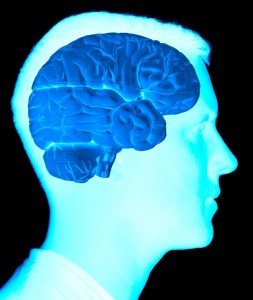
The Brain.. is ..The Brain !!!
From the young to the old, the brain remains constant as to how it is designed, and how it operates and behaves.
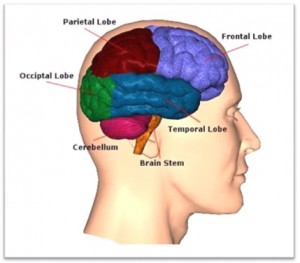
From around the world,
All brains
Are designed the same.
This means that what is successful for one brain will be successful for all brains, and improving the brain, improves behavior.
Neurofeedback Is for Everyone
From the Youth
In School

To Young Students
In College

From the
Rising Young Executives
On Their Way to the Top

To Those with a Vision
To Accomplish

To Those who Have Made It
And Now want to
Keep their Mental Abilities
And Skills

Neurofeedback
Is Important
For ALL AGES
And for ALL Situations In Life
For
Increasing Brain Power
and
Improving
Quality of Life


BRAIN POWER,
YOU CAN HAVE IT !
-
The Benefits
Shown in
Research

Research yields many benefits, both to the individuals participating in the research and in expanding knowledge of the science.

Research
Improving Lives

Research
Increasing Science

Research
Improving the Brain
BRAIN POWER,
YOU CAN HAVE IT
-
Therapies
For
Improving Memory
Neurological Methods
To Increase Brain Activity
The first step is to find out what is malfunctioning in the brain. This is followed by the therapy that addresses that particular problem.
The Main Therapy
Is that of Neurofeedback,
This therapy adjusts the brain waves, from abnormal to normal.
Brain Power
The brain is meant to function brilliantly. It is designed to do so, and the situation is to return it to its natural abilities.
The method is to Re-Train the Brain, to what science knows are the correct brain waves, as to making neural connections using the best sizes and speeds.
Brain Waves
Brain waves operate at set speeds to provide the right frequency, and the correct amplitudes, meaning the right sizes. Any deviation from this causes the brain to be off balance, and this causes disturbances in the brain.
Returning the Brain
To Normal
The are many ways to correct the brain, according to what is malfunctioning. Memory Care of Arizona takes the approach that there are many methods of improving the brain.
These range from working with
- blood flow of the heart & circulation system, to
- proper NUTRIENTS the Brain MUST HAVE, and to
- improving the problems of such things as brain injury and strokes.
Mental Stimulation
The brain must have adequate mental stimulation to operate. Without it, the brain refuses to function as it should.
As the brain is continuously self-pruning and ridding itself of old cells, so too must the brain Re-Build Itself by always and ever adding New Cells of Information to its library of materials.
Cognitive Rehabilitation:
Exercise for the brain.
Crossword puzzles are nice, but computerized software programs to work the brain are faster and better, as they are scientifically designed to activate the brain in set patterns, to adjust the brain’s processes in directions of cognitive rehabilitation.
The Complicated Brain
While working to improve the brain, any one method may be just what the brain needs, but overall the brain is very complicated. It needs to be approached with the idea in mind that a synergistic balanced method of dealing with the brain, as a whole, is the best method of understanding and working to improve it.
Memory Care of Arizona’s
Synergistic
Scientific Program
Memory Care of Arizona’s clinical program of brain enhancement is designed to look at the WHOLE BRAIN with all of its many parts, viewed as working SYNERGISTICALLY TOGETHER for WHOLE BRAIN IMPROVEMENT.


BRAIN POWER,
YOU CAN HAVE IT
-
The Books
For
In-Depth Knowledge
Then Go to the Web Sites
for
More Information on
Brain Mapping and Neurofeedback


BRAIN POWER,
YOU CAN HAVE IT !
-
Nutrition
For
The Brain
Mild Cognitive Impairment will occur in about one third of adults as they age, for brain nerve cells decrease as people get older.
 Will you, or someone you know, be one of them ???
OR, will you be bright and full of life ???
 The choice is YOURS !
Physical changes occur both in the body and in the brain. The brain operates by chemical processes called neurotransmitters, such as serotonin and acetylcholine, primary transmitters for learning and memory.
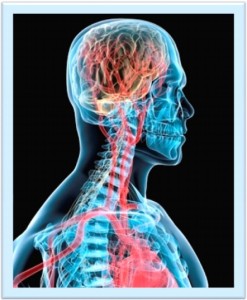
As people get older, their levels of neurotransmitters DECREASE,
and MEMORY goes DOWN.
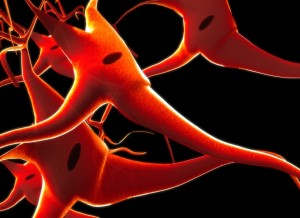
The idea is to
support the brain
by giving it nutrition of serotonin and acetylcholine. to feed, nourish, and REPLENISH the brain and memory.
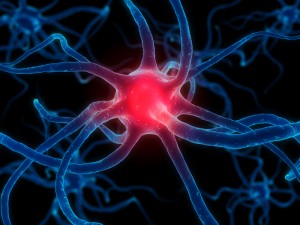
This can be done by eating the best correct foods in their healthy form.

A more precise method is by taking the manufactured supplements that are designed to do this, of providing the neurotransmitters
that are
important to the brain.
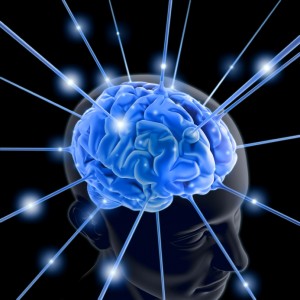
Memory Care of Arizona has carefully researched the companies and carries the BEST in our offices, along with many other nutrients that are DESIGNED SPECIFICALLY to improve
the brain and memory.

Come into our office and MEET with THE DOCTORS who specialize in the specific needs of the brain, of how to provide to the brain, what the brain needs to be healthy.

The Solution resides in the correct nourishment of the brain in the form of
- Nutraceuticals
- Nutrients and Supplements
- Lifestyle Changes


BRAIN POWER,
YOU CAN HAVE IT !

-
Mapping the Brain
The study of the human brain has long fascinated research scientists.

The knowledge gained from the research enables Neurologists to help individuals who need it.

One of the more advanced methods of “taking a look” at an individual’s brain is that of the EEG Brain Mapping.
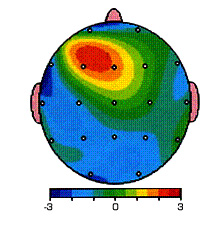
From a Brain Map, the scientist can determine which areas of the brain are malfunctioning, and need to be adjusted, to bring the brain back into proper balance.

The knowledge from the EEG Brain Map is used by the Neurofeedback therapist to “re-train” the brain and restore the brain’s ability of internal connections, restoring MEMORY.

It is this specialized knowledge that Memory Care of Arizona possesses in working with elderly patients, in improving their lives.
Adding LIFE TO THEIR YEARS and also improving the elderly’s QUALITY OF LIFE.


BRAIN POWER,
YOU CAN HAVE IT !


